Overview
Evaluation is a critical step in developing effective RAG pipelines. It helps you:- Measure the quality of retrieved information
- Assess the relevance of chunks to user queries
- Identify gaps in your knowledge base
- Optimize your retrieval and chunking configurations
- Compare performance across different pipeline versions
The Evaluation Component
In Graphor’s Flow Builder, the Evaluation component analyzes the performance of your retrieval and response generation: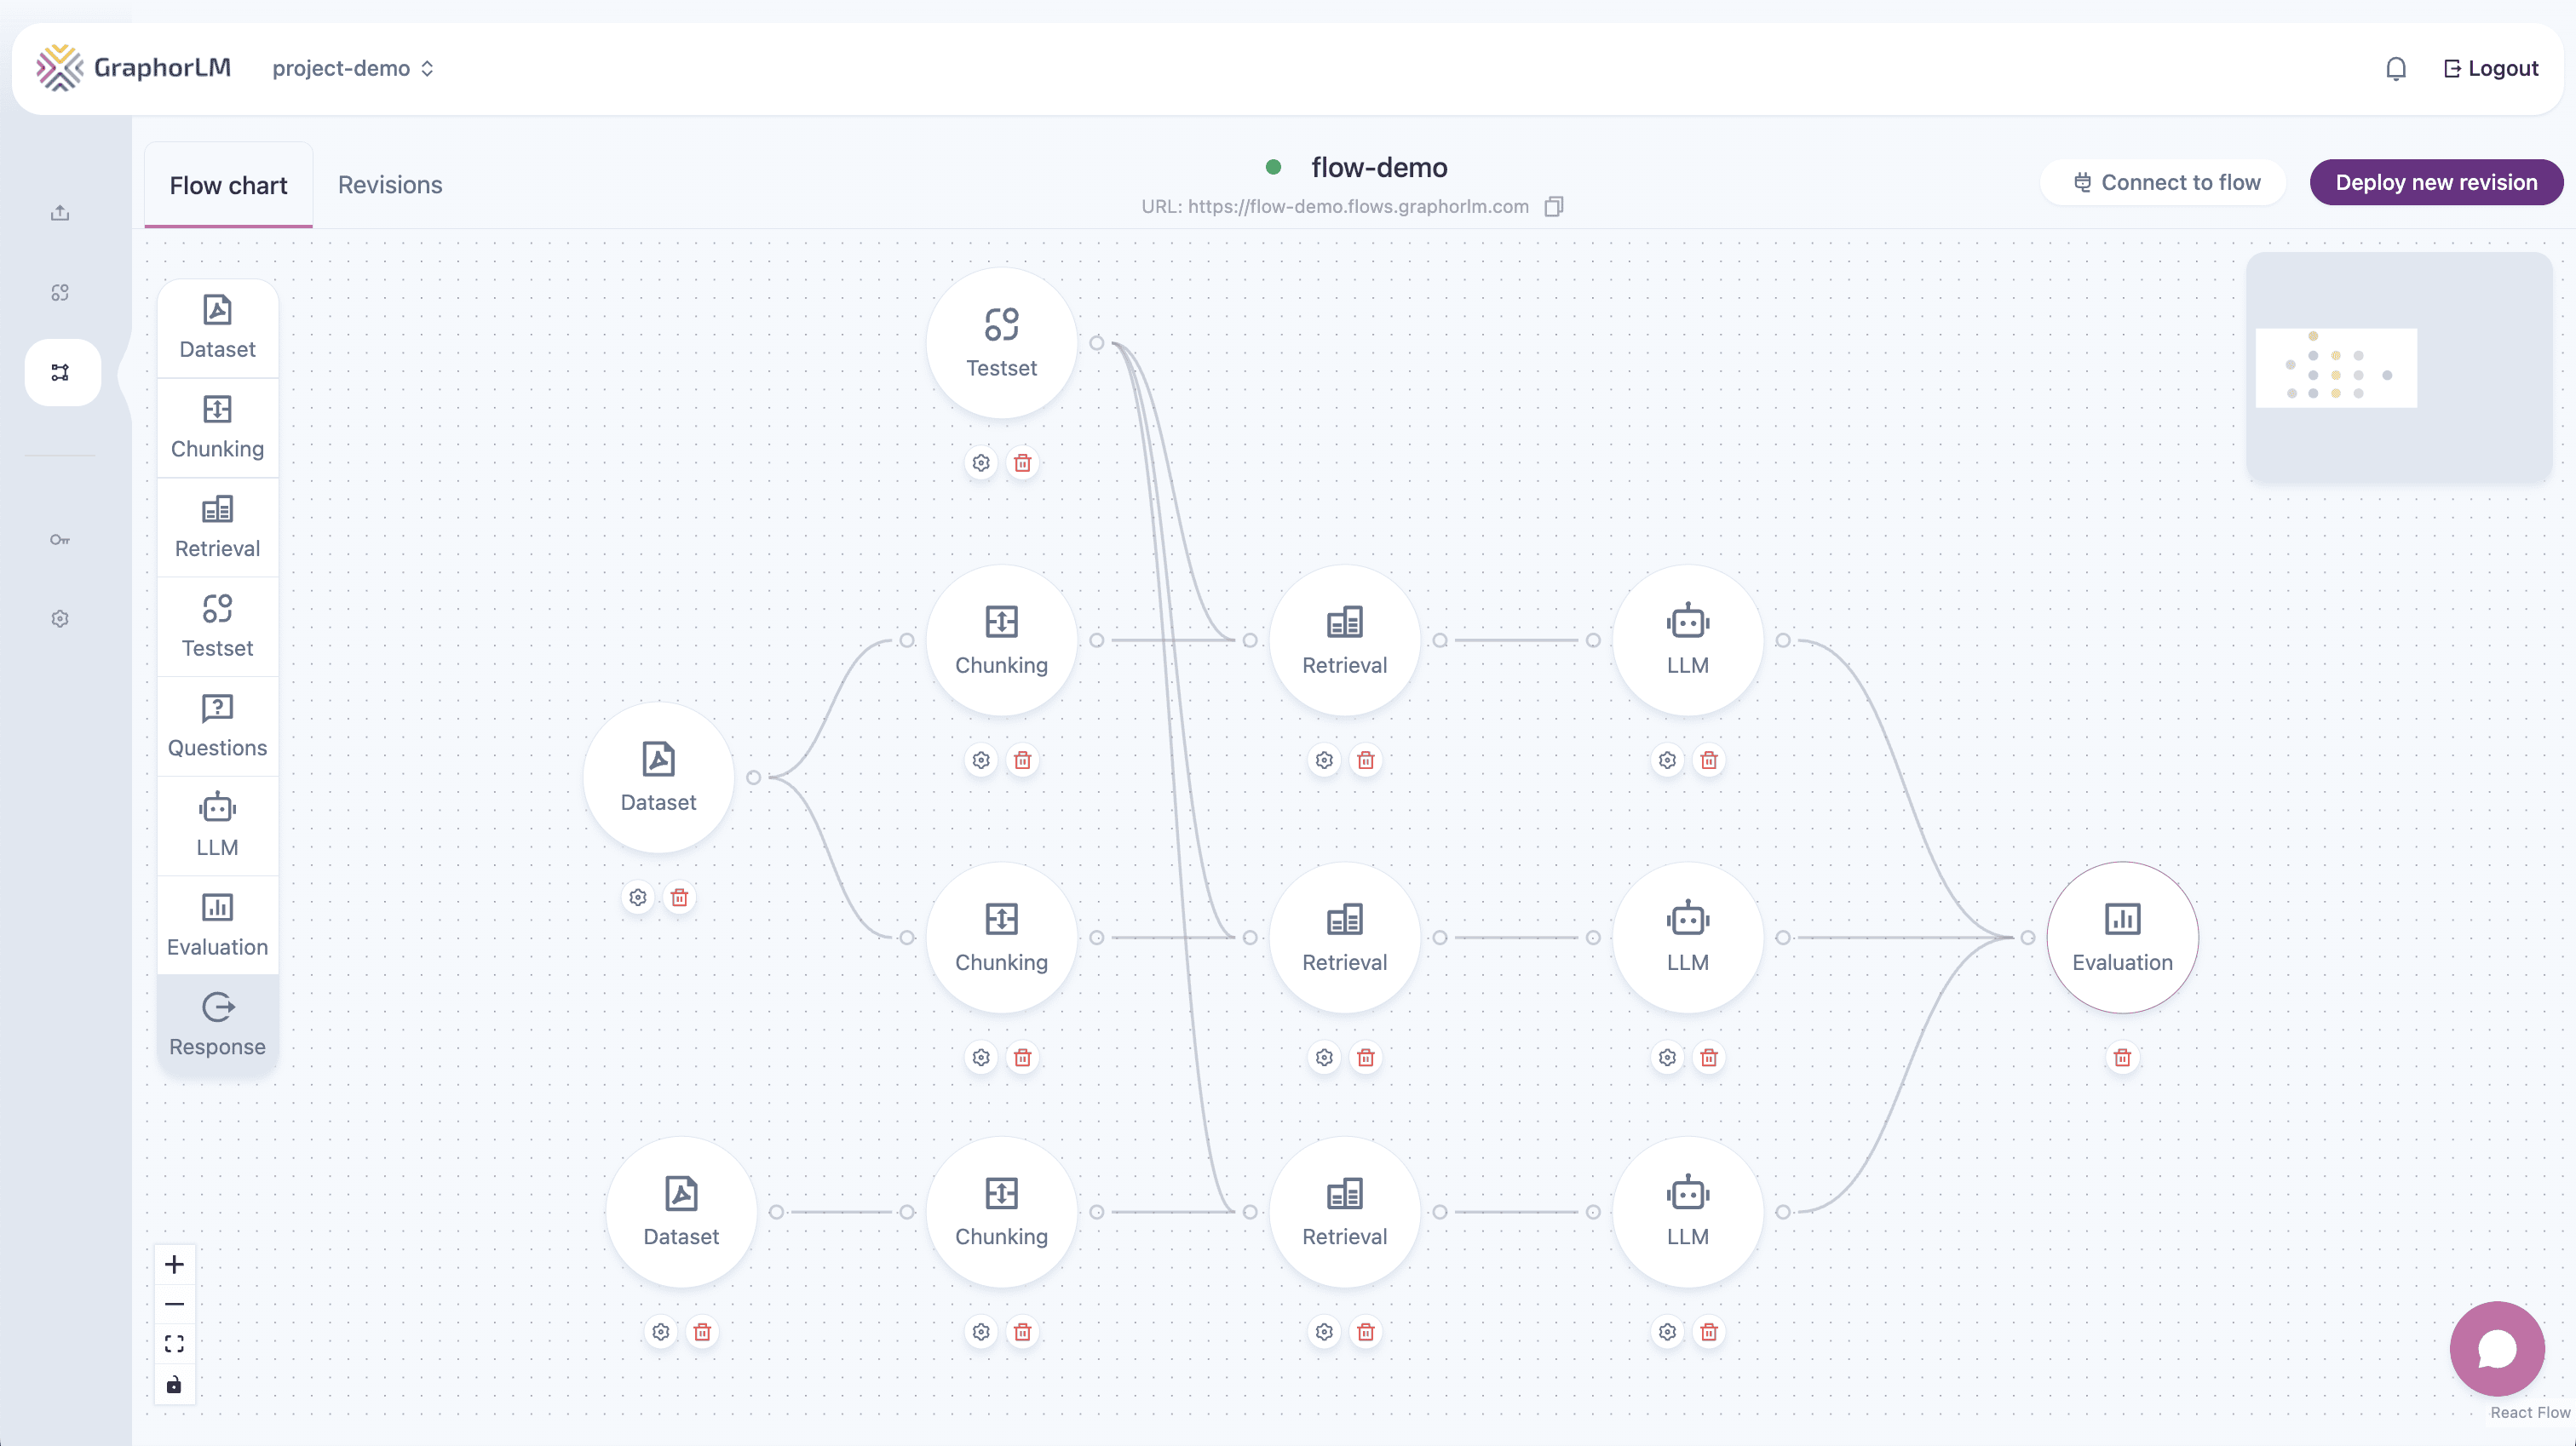
- A Retrieval node to evaluate retrieval quality
- An LLM node to evaluate response quality (if you’re using the optional LLM component)
Configuring the Evaluation Component
To set up evaluation for your RAG pipeline:- Add the Evaluation component to your flow
- Connect it to the output of the component(s) you want to evaluate
- Make sure you have a Testset or Question node connected to your flow
- Double-click the Evaluation component to open its configuration panel
- Click Update Results to generate the evaluation
Required Components
The Evaluation node requires:- A properly configured Testset or Question node with questions and expected answers
- One or more Retrieval or LLM nodes to evaluate (you can connect multiple for comparison)
Comparing Multiple Strategies
One powerful feature of Graphor’s evaluation system is the ability to compare different configurations simultaneously:- You can connect multiple Retrieval nodes to a single Evaluation node
- You can connect multiple LLM nodes to a single Evaluation node
- Each connection creates a separate evaluation dataset for easy comparison
Creating Effective Testsets
Testsets are collections of queries and expected answers that serve as ground truth for your evaluation: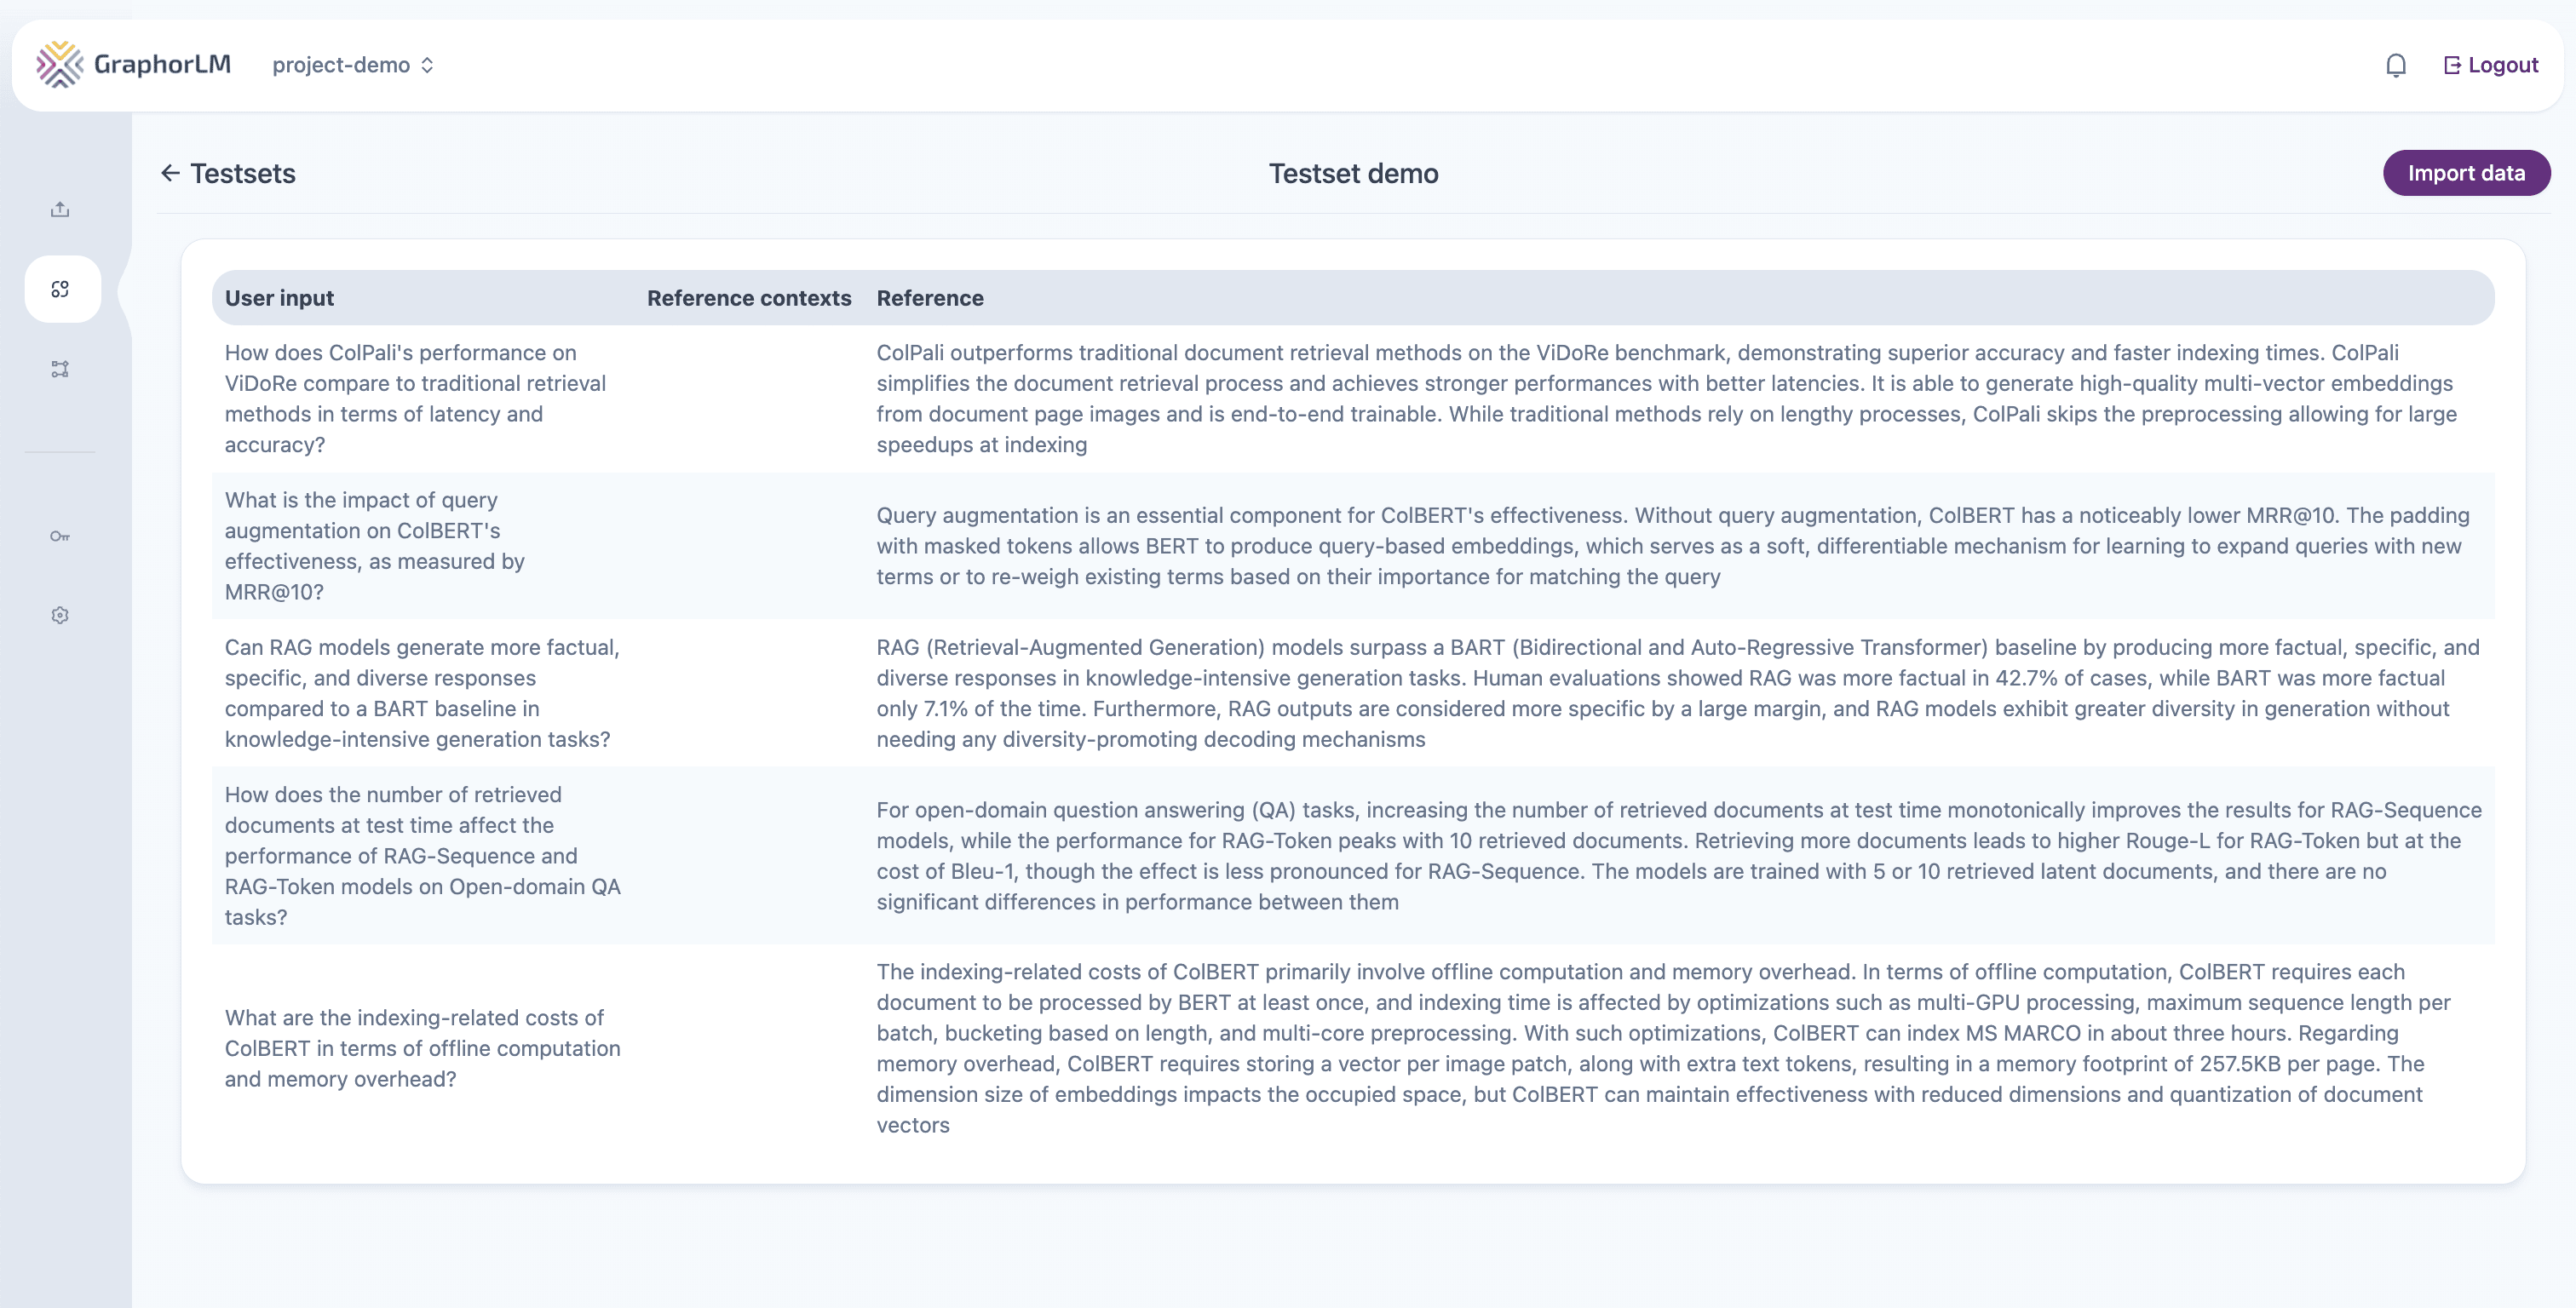
- Navigate to Testsets in the left sidebar
- Click New Testset
- Add questions that represent typical user queries
- Provide expected answers for each question
- Save your testset with a descriptive name
Testset Best Practices
- Include diverse question types: Mix factual, conceptual, and reasoning questions
- Cover edge cases: Include questions that might be challenging for your system
- Use real-world examples: Base questions on actual user queries when possible
- Provide comprehensive expected answers: Include all key points that should be covered
- Update regularly: Add new questions as you discover gaps or receive new user questions
Evaluation Metrics
Graphor provides five key metrics to evaluate different aspects of your RAG pipeline:Retrieval Metrics
For evaluating retrieval quality:-
Relevance: Measures how well the retrieved documents relate to the query
- Higher values indicate retrieved chunks contain information pertinent to the question
- Useful for general assessment of retrieval effectiveness
-
Precision: Measures the proportion of relevant documents among the retrieved results
- Higher values indicate better precision in finding relevant information
- Useful for evaluating the quality of your retrieval configuration
-
Recall: Measures the proportion of relevant documents retrieved out of all relevant documents
- Higher values indicate better coverage of available relevant information
- Helps identify if your retrieval is missing important information
Response Metrics (if using LLM component)
For evaluating generated responses:-
Answer Relevance: Measures how relevant the response is to the question
- Higher values indicate the response directly addresses the query
- Helps identify off-topic or irrelevant responses
-
Faithfulness: Measures how well the response sticks to the information in the retrieved documents
- Higher values indicate responses that accurately reflect the source material
- Helps identify hallucinations or made-up information in responses
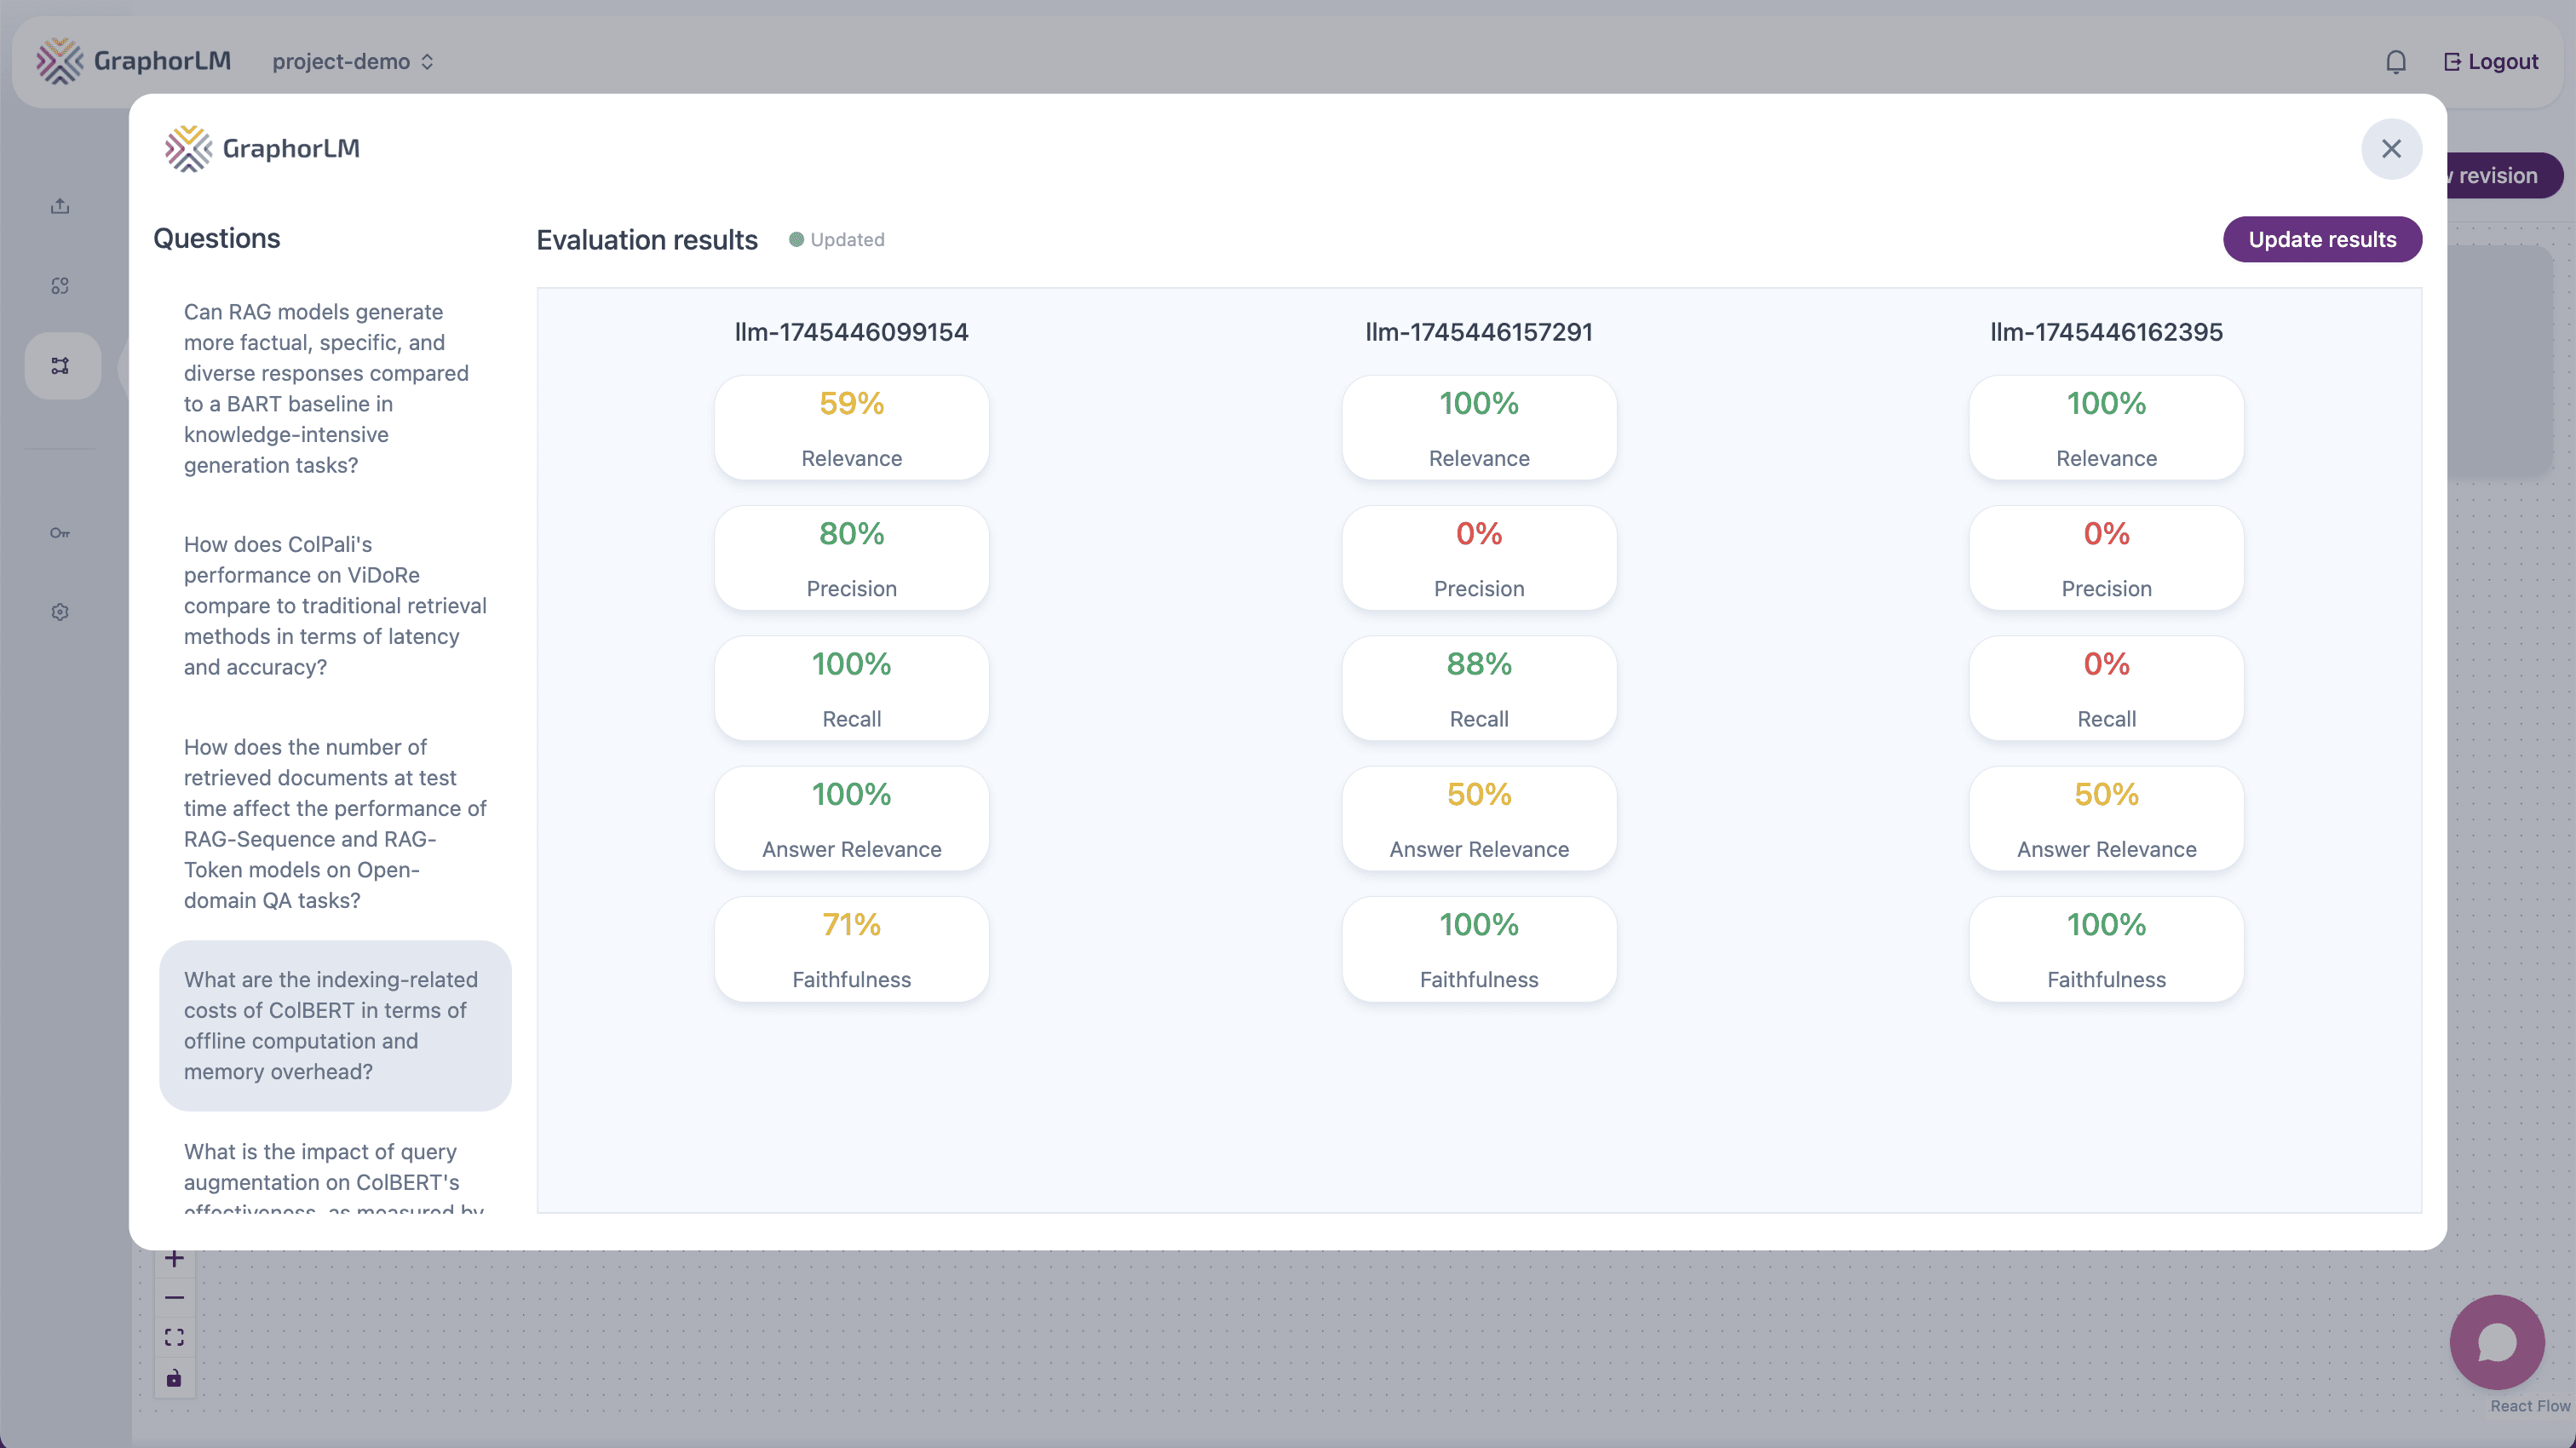
Interpreting Evaluation Results
The Evaluation component displays results in a comprehensive dashboard:- Question list: On the left side, you’ll see all the questions from your testset
- Metrics dashboard: On the right side, you’ll see the evaluation metrics and results
Analyzing Individual Questions
To analyze the performance of specific questions:- Select a question from the list on the left side of the Evaluation component
- The dashboard will update to display metrics specifically related to that question
- Compare how different questions perform across various metrics
- Identify patterns in which types of questions perform better or worse
Understanding Metric Scores
Each metric score includes additional context to help you understand the evaluation:- Hover tooltips: When you hover your mouse over any metric score, a tooltip appears explaining the reasoning behind that particular score
- Score breakdown: See how individual test cases contribute to the overall score
- Score range: All metrics are normalized on a scale from 0.0 to 1.0, with higher values indicating better performance
- Look for patterns: Are certain types of questions performing poorly?
- Compare configurations: Test different retrieval settings and compare metrics
- Identify thresholds: Determine acceptable performance levels for your use case
- Track over time: Monitor how changes to your pipeline affect performance
Common Evaluation Workflows
Basic Retrieval Evaluation
To evaluate just the retrieval component:- Connect a Testset node → Retrieval node → Evaluation node
- Focus on Relevance, Precision, and Recall metrics
- Experiment with different retrieval settings (Search Type, Top K, Score Threshold)
- Compare results across configurations
Full Pipeline Evaluation
To evaluate the complete RAG pipeline with LLM (if using):- Connect a Testset node → Retrieval node → LLM node → Evaluation node
- Analyze both retrieval and response metrics
- Identify which component may be limiting performance
- Optimize components individually and test again
Comparative Evaluation
To directly compare different strategies:- Connect a single Testset node to multiple pipeline branches
- Create different configurations for each branch (e.g., different retrieval settings or LLM prompts)
- Connect all branches to the same Evaluation node
- Analyze metrics side-by-side to determine which configuration performs best
Troubleshooting Evaluation Issues
Poor retrieval metrics
Poor retrieval metrics
Solutions:
- Verify your testset questions are relevant to your document content
- Try different chunking strategies to better preserve semantic meaning
- Adjust Top K or score threshold settings in your retrieval configuration
- Consider using a different search type (Similarity vs. Full text vs. Hybrid)
- Ensure your document collection contains the information needed to answer questions
Poor response metrics (if using LLM)
Poor response metrics (if using LLM)
Solutions:
- Check if the retrieval is returning relevant chunks first (check Relevance scores)
- Review and refine your system prompt and instructions to the LLM
- Try a different model that may perform better for your specific use case
- Ensure your expected answers are comprehensive but not overly specific
- Focus on improving Answer Relevance and Faithfulness scores
Inconsistent evaluation results
Inconsistent evaluation results
Solutions:
- Ensure your testset is large enough for statistical significance
- Check for outliers that may be skewing your overall metrics
- Run multiple evaluation cycles to ensure stability
- Verify that expected answers are consistent in style and scope
Best Practices for Evaluation
- Start early: Integrate evaluation into your development process from the beginning
- Test frequently: Evaluate after each significant change to your pipeline
- Segment results: Analyze performance across different question types or domains
- Compare iteratively: Make one change at a time to isolate its impact
- Balance metrics: Optimize for the metrics most important to your use case
- Consider qualitative review: Supplement metrics with human review of responses
- Document findings: Track what changes led to improvements or regressions
Next Steps
After understanding how to evaluate your RAG pipeline, explore:Retrieval
Optimize your search configuration based on evaluation results
LLM Integration
Refine your language model integration based on response metrics
Chunking
Improve document segmentation to enhance retrieval quality
Integrate Workflow
Deploy your optimized RAG pipeline through API and MCP Server integration